10 min read
Oil price chart explained: WTI crude is at $90.16 a barrel, up 9.78% in three months (Yahoo Finance, November 9, 2026). Over the past month, though, it has slipped 3.82%. So oil is expensive compared with late summer, and it has eased a little from its recent high. For households, that pushes on fuel bills and inflation, and it makes it harder for rates to come down quickly.
Below I go through what moved the price, how a barrel of crude turns into what you pay at the pump, and what I’d keep an eye on over the next few weeks.
Key takeaways
- WTI crude was at $90.16 per barrel on November 9, 2026, up 9.78% over three months and down 3.82% over one month (Yahoo Finance).
- US consumer prices rose 3.74% year over year in September 2026 (Bureau of Labor Statistics), so energy is adding to inflation that is already above the Fed’s 2% target.
- The effective fed funds rate was 3.88% on November 5, 2026 (New York Fed). That leaves the inflation-adjusted policy rate only slightly above zero.
- Gold fell 7.35% over the same three months that oil rose 9.78% (Yahoo Finance), which suggests the oil rally has more to do with supply worries than with a general flight to safety.
What the oil price chart shows right now
The chart above includes oil’s one-month move. That window shows the dip. Stretch it to three months and the bigger trend is up. WTI, the main US crude benchmark, went from roughly $82 a barrel in early August to $90.16 today. I got the $82 by working backward from Yahoo Finance’s 9.78% three-month change.
The one-month figure tells a different story. A 3.82% decline means WTI was near $94 a month ago, so the price peaked and then pulled back. On the latest day it lost another 0.74%.
When people search “oil price chart,” they usually want to know whether oil is high or low. At $90, it’s high compared with three months ago and a bit lower than a month ago. You need both numbers to describe it honestly.
One gap in what I have: my data covers WTI only. Brent, the international benchmark that a lot of searches ask about, isn’t in it. The two prices normally move together, but I won’t guess at a Brent figure.
Why did oil climb almost 10% in three months?
The clearest driver in this week’s news is Iran. CNBC reported on November 8 that President Trump called renewed strikes on Iran “highly unlikely” if talks make progress, but warned he could still strike (CNBC). The URL of that story mentions Hormuz. The Strait of Hormuz is the narrow channel out of the Persian Gulf, and a large share of the world’s seaborne oil passes through it. Any risk to that route adds a risk premium to crude.
Then on November 9 CoinDesk wrote about volatility tied to “failed Iran talks” (CoinDesk). So within two days one outlet focused on hope for progress and another on breakdown. When headlines conflict like that, oil tends to swing in both directions without a clear trend. “Iran war news” is also one of the searches climbing on Google Trends.
The dollar matters less, but it plays a part. Oil is priced in dollars. Over three months the US dollar index rose 2.18% to 101.99 (Yahoo Finance). A stronger dollar usually holds oil back, because buyers paying in other currencies end up paying more. Oil went up anyway, which suggests the supply worry was bigger than the currency effect.
China is another factor I’m watching. CNBC reported that Chinese wholesale inflation hit its highest level in more than four years while consumer inflation slowed (CNBC). Rising factory-gate prices in the world’s largest crude importer fit with costly energy feeding through supply chains. I can’t put a number on how much of that is oil, though.
How does a crude oil move reach your gas tank?
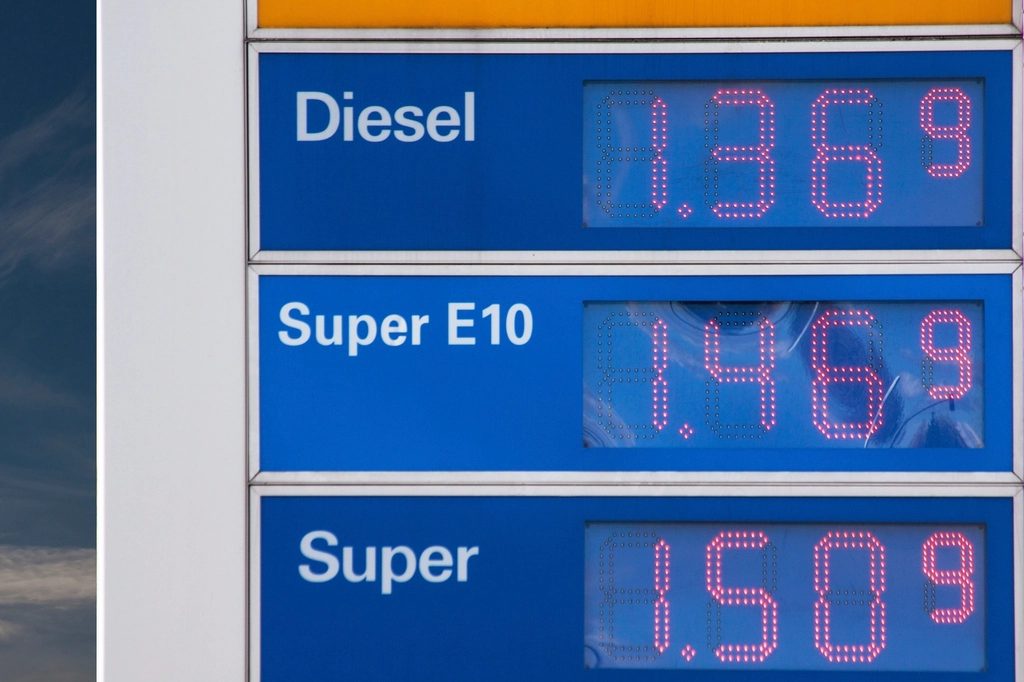
A move on the oil chart doesn’t show up at the pump right away. It goes through several steps.
- Crude futures reprice in seconds when news like the Iran headlines hits. The WTI figure in this article is a futures price.
- Refiners buy crude and turn it into gasoline, diesel and jet fuel. Their margin can widen or shrink on its own, so the pump price doesn’t follow crude exactly.
- Wholesale gasoline prices adjust over days.
- Retail stations change their signs, usually quickly when prices rise and more slowly when they fall.
- Taxes are mostly a fixed amount per gallon, so they soften the percentage change you see.
Here’s a rough rule of thumb. A barrel holds 42 gallons, so each $1 change in crude works out to about 2.4 cents per gallon before refining costs, margins and taxes. WTI’s three-month gain of about $8 comes to roughly 19 cents a gallon in raw crude cost. That’s a ballpark, not a forecast of what your local station will charge.
Fuel is just the first place you feel it. Diesel runs trucks and freight, so higher crude also lifts the cost of shipping groceries, parcels and building materials. That’s how a commodity price ends up in the broader inflation numbers.
What $90 oil means for inflation and interest rates
US CPI inflation was 3.74% in September 2026, according to the Bureau of Labor Statistics. The Fed’s long-standing target is 2%, so prices were already running hot before this round of oil strength. Energy is one of the most volatile parts of CPI. A 9.78% three-month rise in crude makes it harder for headline inflation to come down soon.
Compare that with the effective fed funds rate, which the New York Fed put at 3.88% on November 5. Subtract inflation of 3.74% and the real policy rate is only about 0.14 percentage points. That’s barely restrictive. If oil keeps inflation sticky, the Fed has less reason to cut. Nobody knows yet how the Fed will weigh an oil shock against a job market where unemployment was 4.1% in October (BLS).
The bond market shows the tension. The 10-year Treasury yield was 4.86% on November 6 (Yahoo Finance). It fell 7.11% in relative terms over the past month, but it’s still up 4.05% over three months. Mortgage rates and many loan rates take their cue from that yield, so oil’s effect on inflation expectations eventually shows up in what borrowing costs you.
If you hold stock funds through a retirement plan, this matters too. Higher-for-longer rates usually weigh on growth stocks most. That fits the Nasdaq’s 9.61% one-month fall. I explained how a drop like that hits a balance in what a 5% stock market fall costs your 401(k).
How does oil compare with gold, the dollar and stocks?
Lining oil up against the other big markets helps show what kind of move this is. All figures are from Yahoo Finance as of the date shown.
| Market | Latest level | 1-month change | 3-month change | As of |
|---|---|---|---|---|
| WTI crude oil | $90.16 per barrel | -3.82% | +9.78% | Nov 9, 2026 |
| Gold | $4,094.80 per ounce | -2.29% | -7.35% | Nov 9, 2026 |
| US dollar index | 101.99 | -0.58% | +2.18% | Nov 9, 2026 |
| US 10-year Treasury yield | 4.86% | -7.11% | +4.05% | Nov 6, 2026 |
| S&P 500 | 7,376.86 | -5.00% | -4.91% | Nov 6, 2026 |
| Nasdaq Composite | 24,579.43 | -9.61% | -7.91% | Nov 6, 2026 |
| Dow Jones | 51,285.73 | +0.11% | -5.09% | Nov 6, 2026 |
Over three months oil is the only gainer in the table apart from the dollar and the yield. Gold, which people often buy when they’re worried about inflation, dropped 7.35% in that time. I read that as oil responding to a supply story specific to the Middle East, not to broad inflation panic.
Stocks have had a rough month. The S&P 500 is down 5% and the Nasdaq almost 10%, while the Dow is flat. Headlines point to worries about AI-heavy stocks: MarketWatch ran a piece this week on how exposed the S&P 500 has become to AI. Oil isn’t the main cause of the stock decline, but costly energy and sticky rates add to the pressure. If you own an index fund, my explainer on how an S&P 500 index fund works covers what a drop like this means for it.
What does the 3-month oil move cost a typical household?
Here’s a worked example. The fuel use is made up for illustration. The price change is real.
Say your household buys 50 gallons of gasoline a month. Crude’s roughly $8 three-month rise adds about 19 cents a gallon in raw oil cost. Multiply that by 50 gallons and you get about $9.50 a month, or around $114 a year if crude stays where it is. Refiner margins and local taxes can make the real number at the pump bigger or smaller.
That’s for a single car. A household with two cars and a long commute could easily use twice as much. Heating oil and propane follow crude too, and winter is coming.
Now apply the same logic to $10,000 of savings. With inflation at 3.74%, $10,000 sitting in an account paying nothing loses about $374 of buying power over a year. Savings accounts and money market funds tend to track the fed funds rate, which was 3.88% in early November. A rate near that would roughly match inflation before tax. After tax, most people are still slightly behind.

What happened the last time oil spiked?
The most recent big example is 2022. After Russia invaded Ukraine in February that year, oil rose above $100 a barrel, and US CPI inflation peaked at 9.1% in June 2022. The Fed then raised rates at the fastest pace in decades. Stocks and bonds fell together for most of that year.
Today is different in scale. WTI at $90 is high, but its three-month rise is under 10%, and inflation at 3.74% is far below the 2022 peak. The cause is similar, though: a geopolitical shock to supply hitting an economy where inflation hadn’t fully cooled.
I sold some energy stocks too early in 2022 because I assumed the spike would fade within weeks. It took months. My takeaway from that is to be careful assuming a supply shock will resolve on your schedule.
Common mistakes when reading an oil price chart
The first is reading only one time frame. Look at the one-month view and oil is falling. Look at three months and it’s rising. Neither tells you the whole story, so check at least two.
The second is mixing up WTI and Brent. They’re different benchmarks for different grades and delivery points. Most US articles quote WTI, while international and European coverage often quotes Brent. Check which one you’re looking at before comparing numbers.
The third is assuming the pump will follow day to day. Retail gasoline lags crude, especially on the way down. A 0.74% drop in crude on one day won’t change your station’s sign tomorrow.
The fourth is chasing energy stocks after a headline. Oil reacts within minutes to news like the Iran talks, and you’ll almost never get in ahead of that. If you want energy exposure for its dividends, read how dividend yield works and when it’s a trap first. A high yield on an energy stock can disappear when crude falls back.
What I’d watch next on oil and the economy
Iran talks come first. If progress makes renewed strikes “highly unlikely,” as Trump put it, the risk premium could leave oil quickly. If the talks fail, the three-month uptrend has room to continue. Nobody knows which way it will go.
Next is the October CPI report from the Bureau of Labor Statistics, due later this month. September’s 3.74% is the number to beat. A higher reading would confirm that energy is feeding through, and it would make a near-term Fed cut harder to justify while the fed funds rate sits at 3.88%.
I’d also watch the 10-year yield around 4.86%. If oil pushes inflation expectations up, that yield tends to rise, and mortgage rates follow.
Last is tariffs. CNBC reports that Democrats plan to try to end Trump’s tariffs after the midterms (CNBC), and the URL points to Canada, a major supplier of crude to the US. Any change in trade with Canada is worth following for energy prices, but it’s too early to say what it would do.
This is not financial advice. Do your own research before acting on any of this.
FAQ
What is the oil price today?
WTI crude was $90.16 per barrel on November 9, 2026, according to Yahoo Finance. It fell 0.74% on the day and is down 3.82% over the past month. Over three months it’s up 9.78%.
Why are oil prices high right now?
The main driver in recent news is uncertainty over Iran, including the risk to shipping through the Strait of Hormuz. Headlines this week moved between hope that talks would progress and reports that they had failed. Oil rose even though the dollar strengthened 2.18% over three months, which normally holds crude back.
Does a higher oil price mean higher inflation?
Usually yes. Energy is part of CPI directly, and diesel costs feed into shipping and food. US inflation was already 3.74% in September 2026, so higher crude makes it harder for that figure to come down toward the Fed’s 2% target.
How much does $1 on a barrel of oil add to gas prices?
A barrel holds 42 gallons, so $1 on crude is about 2.4 cents a gallon in raw oil cost. Refining margins and taxes mean the pump price won’t match that exactly. WTI’s roughly $8 three-month rise comes to about 19 cents a gallon before those factors.
What is the difference between WTI and Brent oil?
WTI (West Texas Intermediate) is the US benchmark, priced for delivery in the United States. Brent is the international benchmark based on North Sea crude. They usually move together, but the gap between them changes with shipping costs and regional supply.
Will high oil prices stop the Fed from cutting rates?
They make cuts harder to justify, but they don’t rule them out. The fed funds rate is 3.88% and inflation is 3.74%, so the real rate is close to zero. Unemployment at 4.1% gives the Fed a reason to support jobs as well. The next CPI report will matter more than any one day’s move in oil.
Related reading
This article is for information only and is not financial advice. Crypto assets are volatile; you can lose all of your money.