12 min read
Dividend yield is yearly dividends divided by share price, and a 4.86% Treasury now sets the bar. That 4.86% is the US 10-year Treasury yield on November 6, 2026 (Yahoo Finance), so a stock yielding less needs dividend growth or price gains to make up the difference for the extra risk you’re taking. Below you’ll find the formula, a worked example with $10,000, and the traps I wish someone had shown me earlier.
Key takeaways
- The US 10-year Treasury yield was 4.86% on November 6, 2026 (Yahoo Finance), the benchmark most income investors compare dividend yields against.
- US consumer prices rose 3.74% year over year in September 2026 (Bureau of Labor Statistics), so any yield below that loses buying power before price changes are counted.
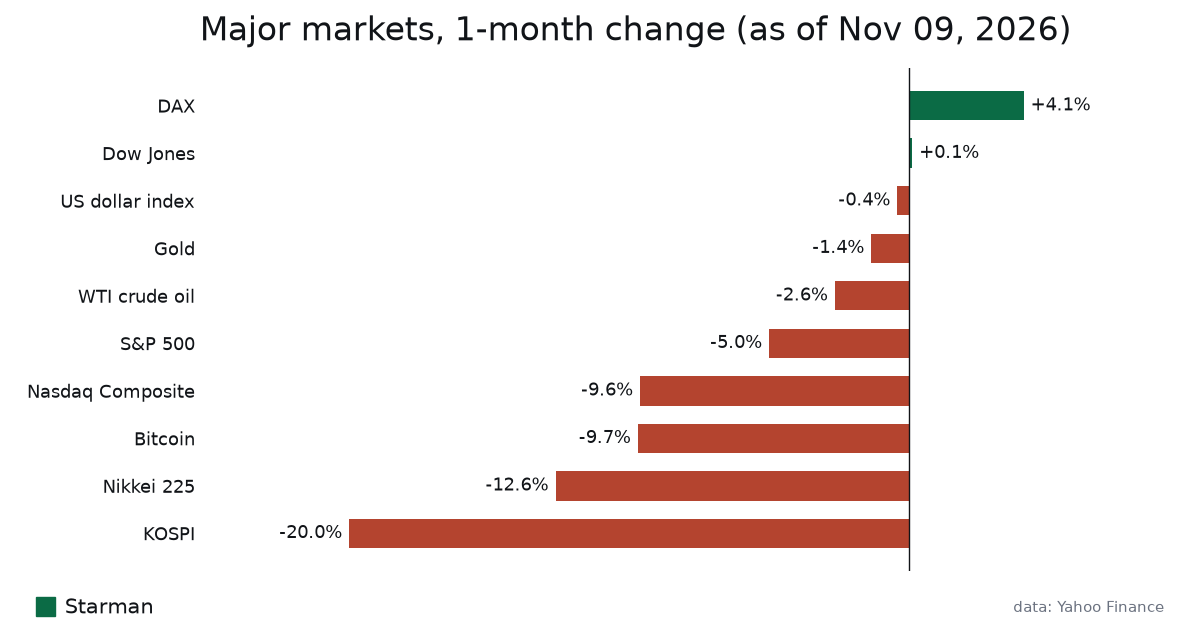
- The S&P 500 fell 5.0% over the past month to 7,376.86 (Yahoo Finance). If dividends stay the same, a 5% price drop lifts a 4.00% yield to about 4.21%.
- The effective fed funds rate was 3.88% on November 5, 2026 (New York Fed), which roughly anchors what cash and money market funds pay.
How do you calculate dividend yield?
The formula is short: annual dividend per share, divided by the current share price, times 100. Everything else people say about yield builds on that one line.
- Find the latest dividend per payment. Your broker’s quote page or the company’s investor relations page will show it.
- Multiply by the number of payments per year. Most US companies pay quarterly, so that’s four. Some pay monthly, some twice a year.
- Divide that annual figure by today’s share price.
- Multiply by 100 to get a percentage.
A simple, made-up example: a company pays $0.50 a quarter, which is $2.00 a year. The shares trade at $50. Two divided by 50 is 0.04, so the dividend yield is 4%. Put $10,000 in and you own 200 shares that pay $400 a year before tax.
Keep in mind that the two inputs move at different speeds. The price changes every second the market is open. The dividend only changes when the company’s board announces a new amount, usually a few times a year at most. So most of the day-to-day movement in a quoted yield comes from the price, not from anything the company did.
Why does dividend yield rise when stock prices fall?
Because the price sits in the denominator. If the dividend stays at $2.00 and the price drops, the same $2.00 is a bigger slice of a smaller number. That’s exactly what has been happening across a lot of stocks lately: the S&P 500 closed at 7,376.86 on November 6, down 5.0% over a month, and the Nasdaq Composite fell 9.61% over the same stretch (Yahoo Finance).
Here’s what that does to our $10,000 example. These are illustrative numbers, not any real company.
| Scenario | Share price | Annual dividend | Value of 200 shares | Yearly income | Yield at current price |
|---|---|---|---|---|---|
| Starting point | $50.00 | $2.00 | $10,000 | $400 | 4.00% |
| 5% price drop (like the S&P 500’s month) | $47.50 | $2.00 | $9,500 | $400 | 4.21% |
| 10% price drop (close to the Nasdaq’s 9.61%) | $45.00 | $2.00 | $9,000 | $400 | 4.44% |
| 50% price drop, dividend cut in half | $25.00 | $1.00 | $5,000 | $200 | 4.00% |
Look at the last row. The yield is back at 4.00%, identical to the starting point, yet you’ve lost $5,000 of value and half your income. A yield number on its own can’t tell those two situations apart. You have to look at what happened to the price and the payout separately.
The second thing the table shows: if you already own the shares, your income didn’t change in the first three rows. Your “yield on cost” (dividend divided by what you paid) stays at 4% no matter where the price goes. The higher quoted yield only matters to someone buying today.

Trailing, forward or SEC yield: which number are you looking at?
Two websites can show different yields for the same stock on the same day, and neither is wrong. They’re measuring different things.
Trailing yield (often labeled TTM, trailing twelve months) adds up the dividends actually paid over the past year and divides by today’s price. It’s based on real payments, but it can be stale. If a company cut its dividend last month, the trailing figure still includes the older, bigger payments.
Forward yield takes the most recent payment, annualizes it (times four for a quarterly payer) and divides by today’s price. It reacts faster to a raise or a cut, but it assumes the latest payment will continue for a full year, which nobody can promise.
Funds add two more versions. Distribution yield annualizes the fund’s latest payout. The SEC 30-day yield is a standardized US calculation based on the income the fund earned over the last 30 days, after expenses. I lean on the SEC yield when comparing funds, because every US fund has to calculate it the same way. You’ll find it on the issuer’s fund page or fact sheet.
One more distortion to watch for is a special dividend. A one-time payout gets folded into the trailing number and can make an ordinary stock look like a high yielder for twelve months. If a yield looks oddly high, check the payment history before you trust it.
Is a dividend yield worth it when Treasuries pay 4.86%?
This is the question I’d put at the center of any dividend decision right now. A dividend stock carries company risk and price risk. A Treasury held to maturity pays its stated interest if you hold it. So the comparison has to account for what you’re giving up.
| Income benchmark | Latest figure | Date | Source | What it means for a dividend investor |
|---|---|---|---|---|
| US 10-year Treasury yield | 4.86% | Nov 6, 2026 | Yahoo Finance | The lower-risk income hurdle a dividend stock is measured against |
| Effective fed funds rate | 3.88% | Nov 5, 2026 | New York Fed | A rough guide to what cash and money market funds can pay |
| US CPI inflation, year over year | 3.74% | Sept 2026 | Bureau of Labor Statistics | The rate your income has to beat just to hold its buying power |
| S&P 500, 1-month change | -5.0% | Nov 6, 2026 | Yahoo Finance | Falling prices push quoted yields up across the market |
| Dow Jones, 1-month change | +0.11% | Nov 6, 2026 | Yahoo Finance | Older, established companies held up better than tech over the month |
Run the $10,000 through it. At 4.86%, a 10-year Treasury bought at that yield pays roughly $486 a year in interest. Our 4% dividend stock pays $400. Inflation at 3.74% erodes about $374 of purchasing power on $10,000 over a year. So on income alone, the dividend stock leaves you around $26 ahead of inflation, and the Treasury about $112 ahead.
The case for the stock rests on things that aren’t in that one-year snapshot. A company can raise its dividend over time, while a Treasury coupon is fixed until maturity. The share price can also grow. Both of those can go the other way, too: dividends get cut and prices fall, as the table in the previous section showed.
When does a high dividend yield become a trap?
A yield trap is a stock whose yield looks generous only because the price has collapsed, usually because the market expects the dividend to be cut. The yield is calculated from a payment that may not survive.
History has plenty of these. During the financial crisis, Citigroup cut its quarterly dividend to one cent a share in 2009. In April 2020, when oil demand fell apart during the pandemic, Shell cut its dividend by about two thirds, its first cut since the Second World War. In both cases the yield shown on screens before the cut was far higher than what shareholders ended up receiving.
Energy is worth a specific mention today. WTI crude was $91.33 a barrel on November 9, up 11.2% over three months (Yahoo Finance). Higher oil prices help energy companies’ cash flow, which supports their dividends. That support depends on a price nobody controls, which is why I treat energy yields as cyclical rather than steady.
These are the checks I run before trusting a high yield:
- The payout ratio, which is dividends per share divided by earnings per share. A company earning $2.50 a share and paying $2.00 has an 80% payout ratio, leaving little room if profits dip.
- Free cash flow, since dividends are paid in cash and accounting earnings can flatter the picture.
- Debt levels and upcoming repayments, because lenders get paid before shareholders.
- The dividend history over a full downturn, including whether the company cut in 2020.
- Why the price fell. If the stock dropped with the whole market, like the S&P 500’s 5.0% month, that’s different from a company-specific collapse.
Common dividend yield mistakes to avoid
The most common one is buying just before the ex-dividend date to “catch” the payment. On the ex-dividend date the share price usually drops by roughly the amount of the dividend, so you’ve swapped share value for cash, and in a taxable account you may owe tax on it. No free money changes hands.
Treating yield as your return is the second. Your total return is dividends plus or minus the change in price. A 4% yield with a 10% price drop is a loss of about 6% for the year. In my early years I owned a high yielder that paid me reliably right up until the share price had wiped out several years of dividends. I’d never ignore the price side again.
A third is piling into one sector. High yields cluster in a few industries, often utilities, energy, banks and real estate. A portfolio built by sorting for the highest yield can end up heavily concentrated without you noticing.
Comparing trailing yield on one site with forward yield on another is the fourth, and it’s easy to do by accident. Use the same measure for everything you compare.
Finally, people mix up dividend yield with crypto yields. Staking rewards on a token come from a network’s own issuance and fees, paid in a coin whose price can swing hard. Ethereum, for example, fell 14.13% over 30 days (CoinGecko data). If you want the mechanics, I explained them in how crypto staking rewards actually work. They aren’t comparable to a dividend from company profits.

Dividend stocks vs dividend ETFs vs a broad index fund
A lot of the searches around dividend yield are really about which vehicle to use. Here’s how the three main routes differ.
Individual dividend stocks give you full control and no fund fees. You also carry all the single-company risk, so one cut like the ones above can hit your income hard. You’ll need to do the payout ratio and cash flow homework yourself.
Dividend ETFs and index funds hold dozens or hundreds of payers, so one cut barely moves your income. The fund’s expense ratio comes out of what it earns, which is why the SEC yield (after expenses) is the fair number to compare. Each fund also has its own rules for picking stocks. Some screen for the highest current yield, others for a long record of raising dividends, and that choice changes how the fund behaves in a downturn. Read the methodology on the issuer’s site before you compare yields.
A broad market index fund usually yields less than a dividend-focused fund, because it also holds companies that reinvest profits instead of paying them out. In exchange you get the whole market. I covered how that works in S&P 500 index funds and what a 5% dip means.
One trade-off to know about: MarketWatch recently looked at how exposed the S&P 500 has become to AI stocks, and some investors add dividend payers partly to lean away from that concentration. Over the past month, the tech-heavy Nasdaq fell 9.61% while the Dow, which leans on older companies, rose 0.11% (Yahoo Finance). One month proves very little, but it shows how differently these groups can move.
My own view: for most people, the vehicle matters less than knowing what the yield is made of and whether it fits the rest of what you own.
How do taxes and account type change what you keep?
The yield you see is a pre-tax number. What lands in your pocket depends on the type of dividend and the account it sits in.
In the US, dividends are generally either “qualified” or “ordinary.” Qualified dividends are taxed at lower long-term capital gains rates, but only if you’ve held the shares for a minimum period around the ex-dividend date. Ordinary dividends are taxed like regular income. Some payers, such as many REITs, pay mostly ordinary dividends.
I’m not quoting rates or holding periods here because they change and depend on your situation. Check IRS Publication 550 and the Form 1099-DIV your broker sends each year, which splits the two types for you.
Inside a 401(k) or IRA, dividends aren’t taxed in the year they’re paid, which makes reinvesting them simpler. If retirement accounts are where most of your money sits, my piece on what a 5% stock market drop does to a 401(k) walks through the price side of the same math.
If you live outside the US or own foreign stocks, the dividend may be taxed at source before you ever see it. The rate depends on tax treaties and your broker’s paperwork, so check your broker’s help pages for withholding on foreign dividends.
FAQ
What is a good dividend yield?
There’s no single good number, because it depends on what else pays you right now. With the 10-year Treasury at 4.86% and inflation at 3.74% (September CPI), a yield well below those needs dividend growth to make sense. A yield far above them deserves suspicion until you’ve checked the payout ratio and why the price fell.
How is dividend yield calculated?
Take the annual dividend per share, divide it by the current share price, and multiply by 100. A $2.00 yearly dividend on a $50 share is a 4% yield. Check whether the site uses trailing or forward dividends, since that changes the result.
Is a high dividend yield a good sign?
Not by itself. A very high yield often means the share price has fallen because investors expect a cut. Look at earnings, free cash flow and the dividend’s history before treating a high yield as a bargain.
How often are dividends paid?
Most US companies pay quarterly, which is why you multiply a single payment by four. Some funds and companies pay monthly, and many non-US companies pay twice a year. The payment schedule is listed on the company’s or fund’s investor page.
Do I get the dividend if I buy right before the ex-dividend date?
You need to own the shares before the ex-dividend date to receive the next payment. But the share price typically drops by about the dividend amount on that date, so you don’t come out ahead, and you may owe tax on the payout in a taxable account.
Is dividend yield the same as total return?
No. Total return is dividends plus the change in share price. A 4% yield combined with a 10% price drop leaves you down about 6% for the year.
What I’d watch next if you hold dividend payers
The 10-year Treasury yield comes first. It stood at 4.86% on November 6, and the yield itself is 7.11% lower than a month earlier (Yahoo Finance). If it keeps falling, dividend stocks look relatively better as income. If it climbs back up, the bar gets higher and income stocks often feel the pressure.
Next is the Bureau of Labor Statistics’ October inflation report. September’s 3.74% is the number to compare it with, because your real income is the yield minus inflation. Alongside that, I’d follow Federal Reserve rate decisions against the current 3.88% effective fed funds rate, since cash yields move with it.
For energy payers specifically, I’d keep an eye on WTI crude around $91.33. And for any stock you own, I’d read the dividend line in each earnings release. Whether the company raises, holds or cuts tells you more than the quoted yield ever will.
This is not financial advice, just how I’d approach it. Do your own research before buying anything for its yield.
Related reading
This article is for information only and is not financial advice. Crypto assets are volatile; you can lose all of your money.