10 min read
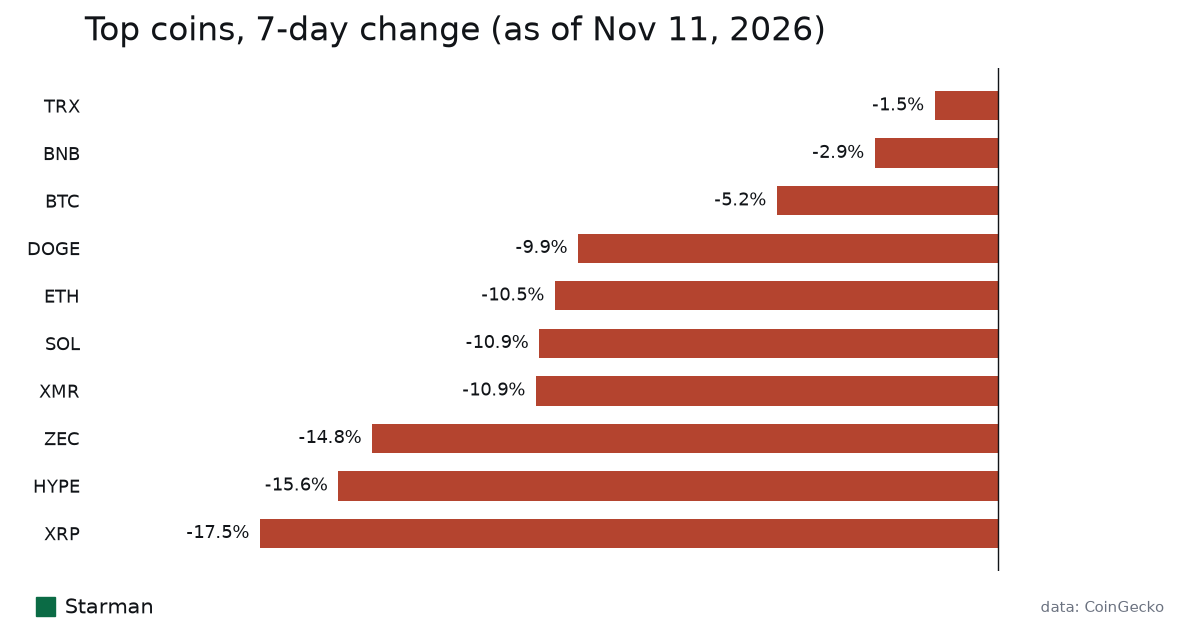
Bitcoin sits at $72,844 after dropping 13.11% in 30 days (CoinGecko, November 10, 2026), and the crypto fear and greed index explained simply: the market is scared. The index stands at 32, in fear territory (Alternative.me, November 10, 2026), as the total crypto market cap shed 6.25% in 24 hours alone. When losses pile up this fast, people want to know if the crowd’s panic is a warning or an opportunity. This guide breaks down exactly how the index works, what the current reading signals, and whether fear actually predicts anything useful for your portfolio.
Key takeaways
- Bitcoin is down 13.11% over 30 days to $72,844, with BTC dominance at 59.71% (CoinGecko, November 10).
- The total crypto market cap dropped 6.25% in a single day.
- Ethereum fell 20.39% in a month to $2,017.31; Solana lost 26.83% to $81.92 (CoinGecko).
- The 10-year Treasury yield stands at 5.01% (Yahoo Finance, November 10, 2026), reinforcing risk-off sentiment across all markets.
What Is the Crypto Fear and Greed Index?
The crypto fear and greed index is a single number from 0 to 100 that tries to capture market sentiment. Zero means extreme fear. One hundred means extreme greed. The index, published daily by Alternative.me and similar trackers, pulls data from several sources and weights them into one score.
Think of it as a thermometer for crowd psychology. When prices crash and panic spreads, the reading drops toward zero. When prices surge and everyone feels invincible, it climbs toward 100. The current reading of 32 puts us in the fear zone, which the index defines as scores between 25 and 49.
How the Index Is Calculated
Most versions use six inputs:
- Volatility (25%): Compares current Bitcoin volatility and drawdowns against 30-day and 90-day averages. Higher volatility usually means more fear.
- Market momentum and volume (25%): Measures buying volume relative to recent averages. Strong buying pushes the index toward greed.
- Social media (15%): Tracks hashtag volume and engagement on platforms like X. Rapid growth in mentions can signal greed; silence can signal fear.
- Surveys (15%): Weekly polls asking traders how they feel. (Some index versions have dropped this component.)
- Bitcoin dominance (10%): When BTC dominance rises, it often means investors are fleeing altcoins for the relative safety of Bitcoin, a fear signal. BTC dominance is currently 59.71% (CoinGecko).
- Google Trends (10%): Searches for terms like “Bitcoin crash” spike during fear; searches for “buy Bitcoin” spike during greed.
The weighting can vary by provider, but the logic stays the same: combine price action, volume, social chatter, and search behavior into one number.
What Different Readings Mean
The index breaks into five zones:
- 0-24: Extreme fear. The crowd is panicking. Historically, this is when contrarians start watching for buying opportunities.
- 25-49: Fear. Sentiment is negative, but not capitulation-level.
- 50: Neutral. The market is balanced between bulls and bears.
- 51-74: Greed. Optimism is building. Risk of overconfidence.
- 75-100: Extreme greed. Euphoria. Often precedes corrections.
At 32, we’re in the fear zone where historically some of the best long-term buying opportunities have appeared. But “historically” doesn’t mean “always,” and timing matters enormously.
Why the Crypto Fear and Greed Index Is Spiking Searches Now
October’s CPI report landed hotter than expected. The core rate rose 0.3% and headline CPI climbed 0.4% (CoinDesk, November 10, 2026). The 10-year Treasury yield stands at 5.01% (Yahoo Finance, November 10, 2026). Risk assets are under pressure as bond yields climb.
The Nasdaq Composite fell 1.19% on the day and is down 8.41% over the past month (Yahoo Finance). Bitcoin, which had been trading somewhat independently of stocks earlier this year, broke lower alongside equities. ETF outflows mounted, and miner MARA reduced its BTC holdings (CoinDesk, November 10, 2026). When Bitcoin drops 2.86% in a day (CoinGecko, November 10, 2026) and altcoins drop harder, the fear index plunges.
The Search Spike Pattern
Google Trends shows the term “crypto fear & greed index” just hit breakout status. This pattern is consistent: when crypto crashes, people search for sentiment tools to figure out if it’s time to buy or run. The index itself uses Google Trends as an input, so there’s a feedback loop. More searches about fear often mean the index reading gets even lower.
What the Numbers Look Like Right Now
| Asset | Price (Nov 10) | 24h Change | 30d Change |
|---|---|---|---|
| Bitcoin (BTC) | $72,844 | -2.86% | -13.11% |
| Ethereum (ETH) | $2,017.31 | -5.36% | -20.39% |
| Solana (SOL) | $81.92 | -5.80% | -26.83% |
| XRP | $1.044 | -5.02% | -26.79% |
| Cardano (ADA) | $0.172183 | -4.04% | -32.21% |
Source: CoinGecko, November 10, 2026.
Notice how altcoins are falling faster than Bitcoin. That’s classic risk-off behavior. Investors rotate out of smaller, more speculative tokens and either sell entirely or move into BTC. That shift is reflected in BTC dominance at 59.71% (CoinGecko, November 10, 2026).
Does Fear Actually Predict Anything?
The contrarian logic is simple: buy when others are fearful, sell when others are greedy. Warren Buffett’s line gets quoted constantly. But does it work in crypto?
Historical Examples: When Fear Paid Off
In March 2020, the fear index hit single digits as Bitcoin crashed below $5,000 during the COVID panic. Buyers at that moment saw a 10x return within 18 months as BTC eventually topped $60,000. In June 2022, the index spent weeks in extreme fear after the Terra/Luna collapse. Bitcoin eventually bottomed around $15,500 that November. Patient buyers who accumulated during fear eventually profited substantially.
When Fear Didn’t Signal a Bottom
But the index also stayed fearful for months during the 2018 bear market while prices kept falling from $6,000 to below $4,000. Fear doesn’t guarantee a bottom. It just tells you the crowd is panicking. Sometimes the crowd is right to panic.
In late 2022, the fear index spent nearly three months below 30, bouncing between extreme fear and regular fear while Bitcoin ground lower from $20,000 to $15,500. Anyone who bought at the first extreme fear reading in June 2022 had to wait six months and watch their position drop another 25% before the actual bottom arrived.
What the Index Doesn’t Capture
The fear and greed index doesn’t know about Fed policy, Treasury yields, or real economic data. It’s a sentiment snapshot, not a macro model. Right now, the 10-year yield at 5.01% is pulling capital out of risk assets and into bonds. That’s a structural headwind the index can’t measure.
The index also doesn’t distinguish between retail fear and institutional selling. ETF outflows and miner liquidations (like MARA reducing its holdings) represent real selling pressure from large players, not just panicked retail traders. That distinction matters for how quickly any recovery might happen.
How the Macro Picture Is Driving Fear
The inflation print changed the narrative. Markets had been hoping the Fed would pause or cut rates soon. Instead, CPI came in hot, and rate hike expectations jumped. Higher rates mean:
- Bonds pay more, so risky assets look less attractive by comparison.
- Borrowing costs rise, squeezing leveraged traders and forcing liquidations.
- The dollar tends to strengthen, pressuring BTC (which is priced in dollars globally).
The US dollar index rose 0.70% on the day to 102.36 (Yahoo Finance, November 10, 2026). Gold dropped 2.13% (Yahoo Finance, November 10, 2026). When even gold falls on inflation data, you know the market is pricing in tighter policy, not hedging against it.
The Liquidity Connection
Crypto thrives on liquidity. When rates are low and money is cheap, investors take more risk. When rates hit 5% and you can earn solid returns in Treasury bills, the opportunity cost of holding volatile, non-yielding assets like Bitcoin rises dramatically. That’s the headwind the fear index can’t quantify but your portfolio feels directly.
A Worked Example: What a 13% Drop Means for $10,000
Let’s make this concrete. Say you held $10,000 in Bitcoin 30 days ago. With the 13.11% decline (CoinGecko, November 10, 2026), that position is now worth approximately $8,689, a paper loss of about $1,311.
If you instead held $10,000 in Ethereum, the 20.39% monthly drop means your position is now worth about $7,961, a loss of roughly $2,039. Solana holders with $10,000 have seen it drop to roughly $7,317 after the 26.83% decline.
The point: altcoins amplify Bitcoin’s moves. In fear conditions, that amplification works against you. A portfolio weighted toward altcoins during drawdowns can see 2x or even 3x the percentage losses of a pure BTC position.
What This Means for Your Crypto Holdings
By the numbers
- A $10,000 Bitcoin position has lost about $1,311 after the 13.11% drawdown (CoinGecko, November 10, 2026).
- A $10,000 Ethereum position has lost roughly $2,039 after the 20.39% monthly drop (CoinGecko, November 10, 2026).
- A $10,000 Solana position is now worth about $7,317 after the 26.83% monthly decline (CoinGecko, November 10, 2026).
How we calculated: We started with an example $10,000 portfolio and applied the percentage declines from CoinGecko data dated November 10, 2026.
Comparing the Fear Index to Other Sentiment Tools
The fear and greed index isn’t the only way to gauge market sentiment. Here’s how it stacks up against alternatives:
| Tool | What It Measures | Strength | Weakness |
|---|---|---|---|
| Fear & Greed Index | Blended sentiment score | Simple, one number, free | No macro inputs, lagging |
| Funding Rates | Cost to hold leveraged longs/shorts | Shows derivatives positioning | Can stay extreme for weeks |
| On-Chain Realized Losses | How much BTC moves at a loss | Hard data, no surveys | Lags price action |
| Social Volume | Mentions on Twitter/X, Reddit | Real-time sentiment | Noisy, easily gamed by bots |
| Exchange Inflows | BTC moving to exchanges (potential selling) | Actual on-chain behavior | Doesn’t capture OTC deals |
The fear index is a blunt tool. Pair it with funding rates and on-chain data if you want a fuller picture. Right now, ETF outflows and miner selling confirm that fear isn’t just retail panic. Institutions are de-risking too.
Common Mistakes When Using the Fear Index
Treating fear as an automatic buy signal. Fear can stay elevated for months. The index hit single digits in late 2022 and stayed depressed for weeks before the actual bottom. Buying the first fear reading in that cycle meant watching your position drop another 20-30% before recovery.
Ignoring position sizing. Even if you’re confident the bottom is near, putting 100% of your capital in at once is a gamble. Dollar-cost averaging spreads risk across multiple entry points. If Bitcoin drops another 10% after you buy, you’ll have capital left to add at lower prices.
Forgetting macro. The index doesn’t know the Fed’s latest signals on rates. A 5% Treasury yield is real competition for your capital. Fear alone won’t reverse that structural headwind.
Using fear to justify overleveraging. Some traders see fear and think it’s time to go 10x long. The problem: volatility in fear environments is also extreme. A 5% move against you at 10x leverage wipes out 50% of your position. Most liquidations happen when traders are “right about direction, wrong about timing.”
Cherry-picking historical examples. It’s easy to point to March 2020 and say “see, extreme fear was the bottom.” But for every perfect example, there’s a June 2022 where extreme fear arrived four months before the actual bottom.
What to Watch Next
December 18 FOMC decision. If the Fed hikes and signals more to come, expect another wave of selling. If they pause and sound dovish, risk assets could bounce hard. The forward guidance matters more than the decision itself.
BTC support at $70,000. That’s a round number with psychological significance. A break below could push the fear index into extreme fear territory and trigger more liquidations in the derivatives market.
ETF flow data. If spot Bitcoin ETF outflows continue, it shows institutions are still reducing exposure. Watch for a reversal to sustained inflows before calling a bottom. One day of inflows means nothing; a week of consistent inflows suggests real demand returning.
The next CPI print. If November’s inflation data comes in cooler, rate expectations could shift and provide relief for risk assets. If it’s hot again, expect another leg down.
This is not financial advice. Do your own research before making any investment decisions.
FAQ
What is the crypto fear and greed index?
It’s a daily sentiment score from 0 (extreme fear) to 100 (extreme greed) that combines Bitcoin volatility, trading volume, social media activity, BTC dominance, and Google search trends. The goal is to show whether the market is panicking or euphoric. The current reading of 32 indicates fear.
Where can I check the crypto fear and greed index?
Alternative.me publishes a free daily reading at their website. Several other sites, including CoinMarketCap and LookIntoBitcoin, offer similar indexes with slightly different methodologies. Most update once daily around midnight UTC.
Is fear a good time to buy Bitcoin?
Historically, buying during fear has sometimes produced strong long-term returns, but timing is impossible to predict. Fear can persist for months, and prices can fall further before recovering. In June 2022, extreme fear appeared four months before Bitcoin’s actual bottom. Use the index as one input alongside macro data and position sizing, not as a standalone buy signal.
Why is the fear index low right now?
Bitcoin dropped 13.11% over the past month (CoinGecko), the total market cap fell 6.25% in 24 hours, and the October CPI report came in hot. Risk assets sold off across the board, and ETF outflows accelerated.
Does the fear and greed index work for altcoins?
The index is Bitcoin-focused, but altcoins tend to follow BTC sentiment with higher volatility. When the index shows fear, altcoins usually fall harder, as today’s data shows: ETH down 20.39% and SOL down 26.83% over 30 days versus BTC’s 13.11%. The index doesn’t have a separate reading for altcoins.
How often is the crypto fear and greed index updated?
Most providers update the index once per day, typically around midnight UTC. Some offer real-time or hourly snapshots, but the daily reading is the standard reference that most traders cite.
Can the fear and greed index predict Bitcoin’s price?
No. The index measures current sentiment, not future prices. Fear readings tell you the crowd is either panicking or nervous, but crowds can stay irrational longer than your capital can survive. The March 2020 extreme fear coincided almost exactly with the bottom; the June 2022 extreme fear came four months early. Use it as context, not prophecy.
Related reading
Keep reading

This article is for information only and is not financial advice. Crypto assets are volatile; you can lose all of your money.