12 min read
October PPI Report: 0.3% Monthly, 6.5% Annual, Highest Since 2022 →
October PPI report what to expect: it lands Friday at 8:30 ET after a 1.34% September jump. The BLS final demand index went from 157.662 in August 2026 to 159.780 in September, the biggest one-month move in the data going back to August 2025, and that left producer prices about 6.35% higher than a year earlier. The 10-year Treasury yield is at 5.0% and the Fed’s effective rate is 3.88%, so a second hot reading would hit mortgages, growth stocks and bitcoin first. Your bank deposits are not at risk. What you pay to borrow is.
Key takeaways
- Producer prices rose about 1.34% in September 2026 alone, from 157.662 to 159.780 on the BLS final demand index.
- A year on, that index is about 6.35% higher (BLS, September 2025 vs September 2026). Whatever producers pay for inputs, they will try to pass on to you.
- Even a perfectly flat October would leave annual producer inflation at about 6.21%, because October 2025 is a low base (BLS).
- The 10-year Treasury yield sits at 5.0% (Yahoo Finance, November 11), more than a full point above the 3.88% fed funds rate (New York Fed, November 9). Mortgage rates take their cue from that 10-year yield.
When is the October PPI report released?
Exact release time in New York and Seoul
The Bureau of Labor Statistics publishes October 2026 producer prices on Friday, November 13, 2026 at 8:30 a.m. ET. In Korea that’s 10:30 p.m. KST the same Friday.
US stock futures will already be trading, and the cash market opens an hour later. You can check the date on the BLS PPI release schedule, and the numbers go up on the official BLS PPI page the moment they’re released.
Two days earlier the consumer side came out: CoinDesk called the October CPI hot (CoinDesk, November 11). Our October CPI results breakdown covers that report. PPI decides whether the CPI number was a single bad month or part of a pipeline still filling up.
What the producer price index actually measures
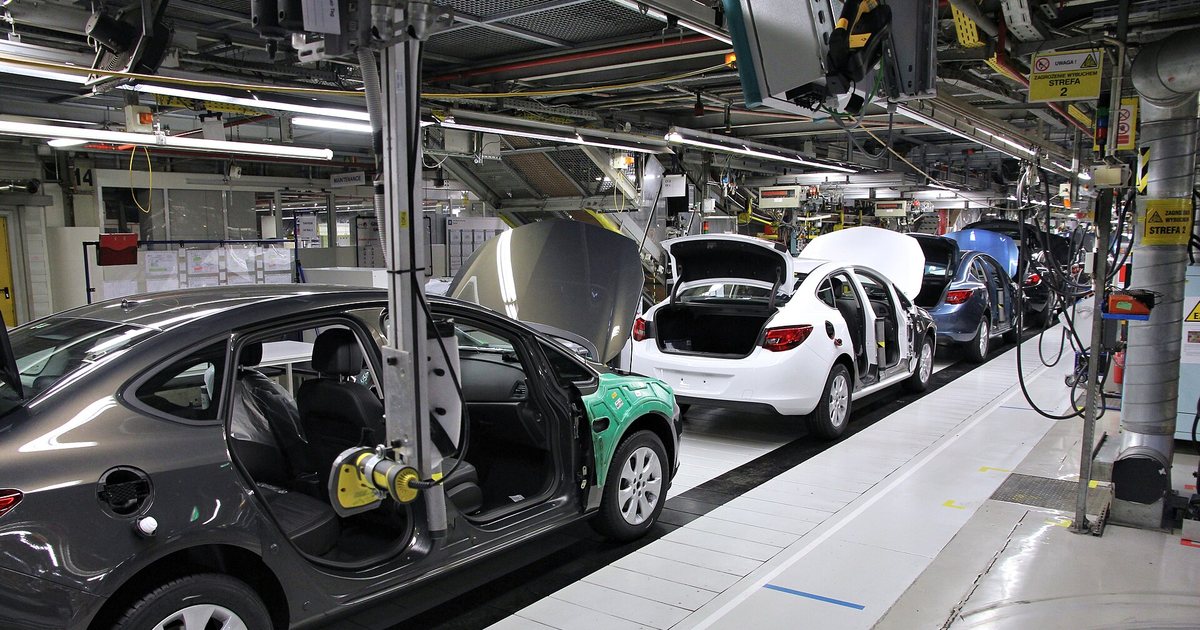
BLS describes PPI as the prices received by producers for final demand goods and services. Think of it as the price tag one step before the shelf: what a manufacturer charges a retailer, what a freight company bills, what a wholesaler or an asset manager collects for a service.
CPI tracks what households pay. PPI tracks what sellers receive. If producer prices climb faster than consumer prices, companies either raise prices later or absorb the cost in their margins. You pay either way, through the checkout in the first case and through weaker earnings in your stock funds in the second.
The headline is “final demand,” which combines goods, services and construction. BLS also publishes a core version that excludes food, energy and trade services. That core number moves less, and it’s a better guide to whether inflation is spreading.
What did the latest PPI readings show?
These are the seasonally adjusted final demand index levels from BLS (series WPSFD4), newest first. A level is not a rate. To get the inflation rate you compare two levels, which I do in the By the numbers box further down.
| Month | PPI final demand index (SA) | Direction vs prior month |
|---|---|---|
| September 2026 | 159.780 | Up sharply |
| August 2026 | 157.662 | Up |
| July 2026 | 156.924 | Up slightly |
| June 2026 | 156.683 | Down |
| May 2026 | 156.874 | Up |
| April 2026 | 156.061 | Up sharply |
| March 2026 | 154.393 | Up |
| February 2026 | 153.204 | Up |
| January 2026 | 152.468 | Up |
| December 2025 | 151.592 | Up |
| November 2025 | 151.054 | Up |
| October 2025 | 150.439 | Up slightly |
| September 2025 | 150.245 | Up |
| August 2025 | 149.327 | Start of data shown |
Why September’s jump stands out
In those 14 months, no monthly step comes close to September’s. The next biggest was April 2026, when the index went from 154.393 to 156.061. June was the only month it fell (156.874 to 156.683). July and August were quiet at 156.924 and 157.662. Then September went to 159.780.
I’d be careful reading too much into one print, because PPI moves a lot more than CPI. Energy prices and retail and wholesale markups can swing it in either direction within weeks. Markets will still treat October as the test of whether September was a blip or the start of a trend.
The base effect that shapes October’s annual rate
Annual rates depend on what happened a year earlier, which economists call the base effect. In October 2025 the index barely moved, from 150.245 to 150.439. That tiny step is this month’s comparison point.
So if the October 2026 index rises by more than last October’s small gain, the annual rate goes up from September’s roughly 6.35%. If the index stays exactly at 159.780, the annual rate is still about 6.21%. Annual producer inflation only drops meaningfully if October’s index actually falls.
October PPI report what to expect: three scenarios
None of the data I’m using includes a consensus forecast, and I’m not going to make one up. What I can do is show what each kind of result would mean, starting from where markets are trading this week.
What if October PPI comes in hot?
Picture another rise on the scale of September. Two big months in a row would mean pipeline inflation: costs building up at producers that usually show up in consumer prices a few months later. Coming two days after a CPI report CoinDesk called hot, that would push markets toward a Fed that holds rates or tightens further.
The first places to feel it would be the 10-year yield, which is already at 5.0%, the dollar, and the Nasdaq, which has already lost 6.39% in a month (Yahoo Finance, November 11).
What if it lands in line with the recent trend?
Say October looks like July or August: an increase, but a modest one. The base effect would still keep annual producer inflation around 6%. Traders would probably skip past the headline and go straight to the core figure and services prices to decide whether inflation is spreading or just coming from a few volatile categories.
What if producer prices cool or fall?
A flat reading or a June-style dip would make September look like a one-off. Yields could come down from 5.0% and rate-sensitive stocks would get some room. It wouldn’t undo a hot CPI, though. The Fed watches consumer prices first, and one cool PPI doesn’t cancel that out.
Whichever case you get, check what drove it. A headline pushed up by energy fades faster than one pushed up by services, because service prices mostly reflect wages and rents, and those don’t reverse quickly.
How does PPI affect the Fed, bond yields and the dollar?
The Fed: effective rate at 3.88%
The effective fed funds rate was 3.88% on November 9 (Federal Reserve Bank of New York). Unemployment was 4.1% in October (BLS). Hiring hasn’t broken down, so the labor market gives the Fed no reason to cut, and a hot PPI would take away the inflation argument for cutting as well.
This isn’t stagflation, meaning high inflation plus weak growth and rising joblessness, at least not yet. A 4.1% unemployment rate is not a weak economy. The danger is the inflation half of that word sticking around while growth slows.
Treasury yields: the 10-year at 5.0%
The 10-year Treasury yield closed at 5.0% on November 11 (Yahoo Finance). The yield is 6.7% higher than three months ago, measured as a change in the yield itself. It sits more than a full percentage point above the overnight rate.
Some of that gap is the term premium: the extra yield investors want for locking money up for ten years instead of rolling over short-term bills. Inflation that won’t settle is the main thing that pushes it higher. A hot PPI would argue for a bigger premium, and a cool one would ease the pressure a bit.
The dollar, the won and global supply chains
The US dollar index is at 103.0, up 2.99% in three months (Yahoo Finance, November 12). Higher US yields bring money into dollars. USD/JPY at 159.75 shows the carry trade in action: investors borrow in a low-rate currency like the yen and buy higher-yielding dollar assets. For Korean readers, USD/KRW is at 1,330.28, with the won 5.8% stronger against the dollar over three months.
Trade costs flow straight into producer prices. On November 11, Canada’s ambassador warned that US tariffs are driving up costs (CNBC), and tariff costs show up in PPI before CPI. Energy is the other big input. WTI crude is at $86.29, down 9.25% over the past month but up 3.63% over three months (Yahoo Finance). That one-month window runs mid-October to mid-November, so it doesn’t line up with October cleanly, and nobody can say yet how much cheaper oil will pull the October number down.
What would a hot or cool PPI mean for stocks and ETFs?
The S&P 500 closed at 7,619.38 on November 11, up 1.31% that day but down 2.38% for the month (Yahoo Finance). The Nasdaq Composite, at 25,466.19, is down 6.39% in a month. The Dow is up 1.58% over the same stretch. Within US stocks, money has been moving out of tech and into everything else.
Here’s why rates matter so much for tech. A stock’s value is today’s worth of all its future profits. When yields rise, profits that are far in the future count for less today, so fast-growing companies whose earnings are years away take the biggest hit. A hot PPI that lifts yields would land hardest on the Nasdaq.
There’s another story going on Friday. Nasdaq futures fell after Nvidia dropped 8% in after-hours trading on a report that its board may remove CEO Jensen Huang (MarketWatch). Tech could get one shock from the board and another from the inflation data in the same session.
Which ETFs feel the PPI first
Nasdaq-heavy funds and long-dated Treasury ETFs are the most sensitive. Long bond prices fall when yields rise, and the further out the maturity, the bigger the drop. Short-term Treasury bill funds sit at the other end: when the Fed stays tight, their payouts stay high. Broad S&P 500 index funds fall in between, because they hold banks and energy companies along with the tech giants.
Outside the US the reaction varies. Germany’s DAX is up 5.55% in a month, while the KOSPI is down 11.56% and the Nikkei 225 is down 10.34% (Yahoo Finance). A stronger dollar after a hot print would put more pressure on Asian markets.
How could the PPI report move gold and bitcoin?
Why gold has been slipping
Gold futures are at $3,985 an ounce, down 2.99% in a month and 10.8% in three months (Yahoo Finance, November 12). Gold pays no interest, so when a 10-year Treasury pays 5.0%, holding gold has a real cost. A firmer dollar also makes gold more expensive for buyers paying in other currencies. A hot PPI would push in the same direction gold has been going. A cool one would ease up on both.
Bitcoin’s reaction to inflation data
Bitcoin is at $73,599, down 8.66% in seven days and 11.84% in 30 days (CoinGecko). CoinDesk reported that it barely moved on the hot CPI as ETF selling slowed, and then that ETF outflows ran to a fourth straight day while stocks bounced (CoinDesk). The whole crypto market is down 3.07% in 24 hours. Bitcoin’s share is 59.88%.
Altcoins are falling harder. Ether is down 15.64% in a week and XRP is down 20.5% (CoinGecko). That’s what risk-off looks like, with investors cutting their most speculative positions first.
Bitcoin tends to do best in a liquidity rally, when cheaper money pushes up anything risky. A hot PPI makes that harder. My post on why bitcoin is stuck under $74K covers the flows in more detail.

What the PPI report means for your mortgage, savings and investments
Mortgages and loans
Fixed mortgage rates generally follow the 10-year Treasury, not the Fed’s overnight rate, and the 10-year is at 5.0%. A hot PPI that pushes it higher would make new mortgages and refinancing more expensive. My piece on whether mortgage rates dropped today explains how that link works. Higher rates also deepen the lock-in effect: homeowners with older, cheaper mortgages stay put, so fewer homes come up for sale.
Cash, savings and whether your money is safe
A PPI number does nothing to the safety of a bank deposit. FDIC insurance covers up to $250,000 per depositor, per bank, per ownership category, whatever the inflation data says. What matters is the yield. Savings and money market rates follow the fed funds rate (3.88%), so a hot print that keeps the Fed tight also keeps those yields from falling. The catch is that inflation keeps eating into what that cash can buy.
By the numbers
- The BLS final demand index rose from 157.662 (August 2026) to 159.780 (September 2026), an increase of about 1.34% in a single month.
- Against 150.245 in September 2025, the September 2026 index is about 6.35% higher, so producers charge roughly $106.35 for what cost $100 a year ago.
- If the October 2026 index stayed flat at 159.780, it would still be about 6.21% above October 2025’s 150.439.
- The Nasdaq Composite’s 6.39% one-month drop (Yahoo Finance, as of November 11, 2026) took about $319.50 off a $5,000 Nasdaq-tracking position.
How we calculated: percentage changes use BLS seasonally adjusted PPI final demand index levels (series WPSFD4) for the months named, and the position example applies Yahoo Finance’s 1-month Nasdaq Composite change as of November 11, 2026 to a $5,000 example amount.
Korean investors with US holdings have a currency effect on top. The won has strengthened 5.8% against the dollar over three months to 1,330.28, so dollar assets are worth less in won even when they hold steady in dollars. A hot PPI that lifts the dollar would offset some of that. A cool one wouldn’t.
Common mistakes when trading the PPI release
- Trading the first minute. Futures often swing both ways right after 8:30 ET as algorithms react to the headline, then reverse once people read the core numbers.
- Treating the index level as the inflation rate. 159.780 is a level. The rate comes from comparing it with an earlier month, as in the box above.
- Forgetting revisions. BLS revises earlier months, so September’s 159.780 could change on Friday, and a revision can matter as much as the new number.
- Using leverage into the release. A short squeeze, where short sellers are forced to buy back all at once, can drive a price up fast enough to wipe out a leveraged bet even if your read on inflation was correct.
- Assuming PPI moves CPI one for one. Some of the producer cost gets absorbed in margins, which hurts earnings rather than lifting consumer prices.
FAQ
What time is the PPI report released tomorrow?
BLS releases the October 2026 PPI on Friday, November 13, 2026 at 8:30 a.m. ET. That’s 10:30 p.m. KST in Korea. The data is posted on the BLS PPI page at that time.
What is the difference between PPI and CPI?
PPI measures the prices producers receive for final demand goods and services. CPI measures the prices consumers pay. PPI sits earlier in the chain, so it can show cost pressure before it reaches store shelves.
Does a high PPI mean CPI will rise?
Not automatically. Companies can pass higher costs on or absorb them in their margins, and which they choose depends on demand. Two hot PPI months in a row make a pass-through more likely, and September’s 1.34% jump means October is being watched closely.
How does PPI affect mortgage rates?
PPI doesn’t set mortgage rates directly. It moves expectations about inflation and Fed policy, and those move the 10-year Treasury yield, now at 5.0%. Fixed mortgage rates generally follow that yield.
Does the PPI report affect bitcoin?
It can, through yields, the dollar and appetite for risk. Bitcoin barely moved on the hot October CPI, according to CoinDesk, but ETF outflows lasted four days in a row. A hot PPI makes it harder for any liquidity-driven rally to get going.
Is core PPI more important than headline PPI?
For judging whether inflation is spreading, usually yes. Core PPI leaves out food, energy and trade services, which swing a lot from month to month. Markets often react to the headline first and then reprice on the core figure.
What I’ll watch when October PPI comes out on Friday
At 8:30 ET (22:30 KST), I’ll look first at whether the October index is above or below 159.780, and whether BLS revised September. Then the core measure and services, to see if the increase is broad or just energy.
After that, the markets: whether the 10-year breaks away from 5.0%, whether the dollar index moves off 103.0, and whether bitcoin ETF outflows run to a fifth day. Over the following weeks, I’m also following Nvidia’s board decision and MSCI’s removal of Strategy from its indexes at the end of November (Cointelegraph). Both could move prices regardless of what inflation does.
This is not financial advice, so do your own research before acting on any of it.
Related reading
Keep reading


Sources bls.gov · coindesk.com · cnbc.com · marketwatch.com · cointelegraph.com
This article is for information only and is not financial advice. Crypto assets are volatile; you can lose all of your money.